
Hi there,
After taking a while to find the right dataset to make us perform the whole cycle of data from gathering through API, storing&querying it, and analyzing to find an interesting insights. Here I’m introducing you to the world bank group API.
- What is API? , and what’s their advantage over traditional file downloading?
- The World Bank Group API
- Process Overview
- International Tourisms
- Analysis Insights
- Conclusions
What is API? , and what’s their advantage over traditional file downloading?
What is API?
Basically, API (Application Programming Interface) is how the machines communicate between each layer of application (from frontend to backend) or even between the machines. You might heard the word like ‘REST API’ or ‘GraphQL’ before. That’s how developer design API from their application.
What’s the advantage of API over traditional file downloading?
Like taking an image of document with scanner and camera, downloading the data through API is like we directly download the data directly from database with more sense of ‘integration’ between the machines. We could list the advantages as follows:
- More sense of integration – we could get the data right from the database. No more querying and upload file in number of source format (e.g. .csv, .xls, .xlsx, .json, .xml, etc.) onto their page from server side. Just make user download it right from the database.
- Download the file without external limitation – Especially with the case of .xls file which limits to larger than 65,536 rows and 256 columns. Despite of the limit expansion with .xlsx file. But the new limit still not big enough to handle the Terabyte-sized Big Data which usually so big that it couldn’t stored and process with a single PC.
- Less exposure to false information – as we download the file right from the server’s database, the data itself has the less exposure to false information due to human errors during querying and uploading the data as mentioned earlier.
The World Bank Group API
The World Bank has released their data publicly for a while now. Then there’re number of third party developers who build their own library to connect with World Bank Open data as they need. Today, we’re gonna learn how to use ‘World Bank Group API (wbgapi)’ which is a python library built to connect with the World Bank’s open data, then extract into pandas DataFrame. As you may know, DataFrame is tabular-like form of data in python which make us transform and manipulate the data very similar way we do it with spreadsheet software (e.g. MS Excel or Google Sheets).
Process Overview
As mentioned, this project was intended to illustrate the whole process of the data pipeline from data extraction from source database to analysis with BI tools. Moreover, we also built web-based interactive dashboard enhanced in narration with Meta’s Llama 3.1 8B model through huggingface’s API suitable for broader scale of users.
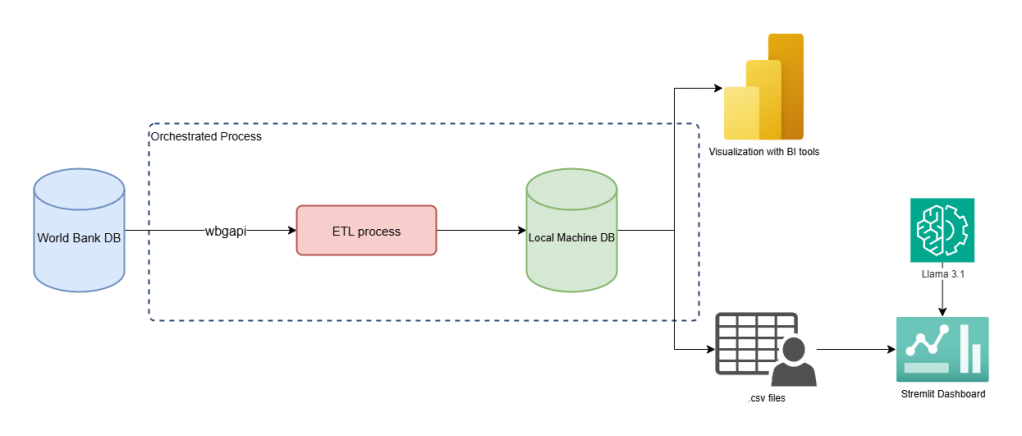
I’ve explained on how to set up the Orchestration Software (Apache Airflow) through Docker, how we set up the ETL pipeline instructions (a.k.a. dags), the configuration, querying the data from our local database, even the full BI report and dashboard via github repository here, so you could see further details there. Right here, we will focused on what we’ve found after we visualized the data.
International Tourisms
When you call for the available indicators from the API, we might found the thousands of indicators available. As we focused on the international tourisms, we considered the following indicators for further analysis.
- Country Name
- Year (from 2000 to 2020)
- Nominal GDP (US Dollars)
- GDP per Capita (US Dollars)
- Population (Person)
- International Tourism Arrivals (Person)
- International Tourism Receipt (US Dollars)
Given with those indicators, I’ve created the new measurements as follows.
- International Tourism Receipt per International Arrivals
- International Tourism Receipt per GDP
- International Tourism Arrival per Population
Analysis Insights
After we put the downloaded data into the visualization tools, we found some interesting patterns as shown as follows:
Highest Tourism-dependent Countries
This measurements is calculated from portion of international receipts by the nominal GDP. This measurement shows the degree of dependencies between international tourism receipts compared to the GDP.
Based on the data as of 2019, we found the countries with the highest portion of internation tourism receipt to GDP as shown below.
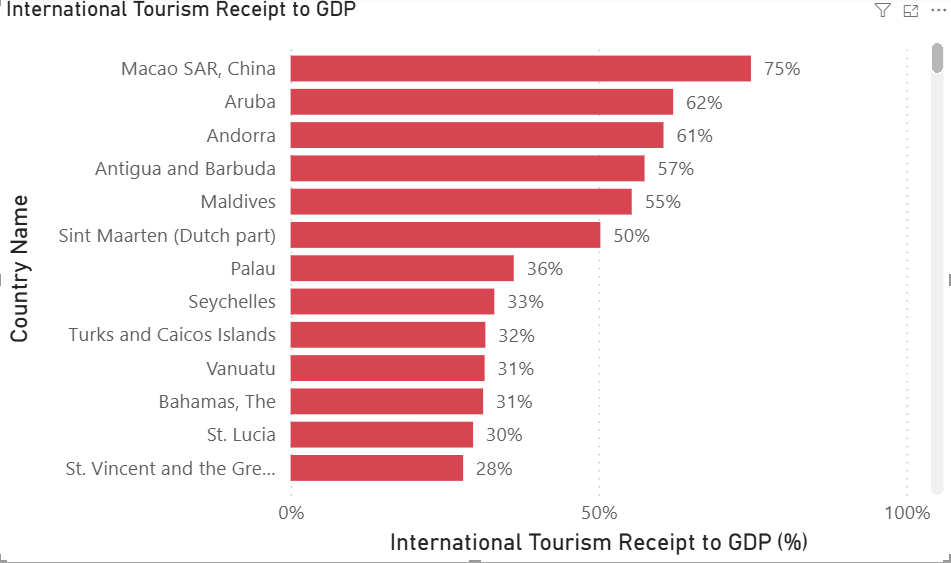
As you might see, the interesting pattern is that almost all the countries with the highest Tourism dependence come from the Caribbean Sea, except the Maldives, which is still an island in the Indian Ocean, and Macao SAR, which is a special economic area under the Chinese Government.
Why does this measurement matter? Because the higher this figure becomes, the lower the risk tolerance of those countries could get. When the world’s tourism froze like the COVID-19 pandemic in 2020, their economy could have become disastrous.
Biggest Amount of Tourists doesn’t mean the biggest Amount of Money.
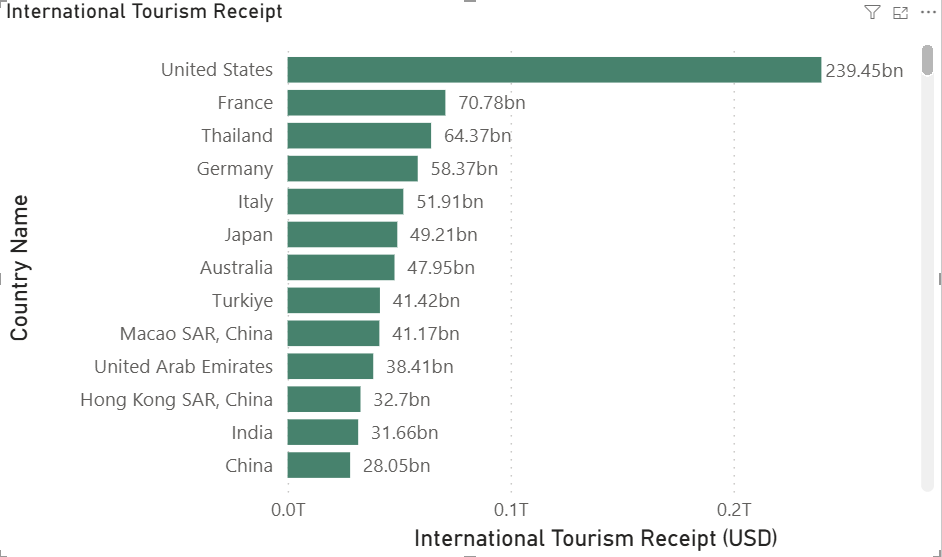
Even though International Tourism contributes a very small amount to their GDP (around 1.11%), the United States is the country that receives the greatest amount due to international tourism in the world. With around 240 billion US Dollars in 2019, this is far greater than France, its closest competitor, by 3 times.
When we take a look at the number of international tourists in the same year, we could see the following results.
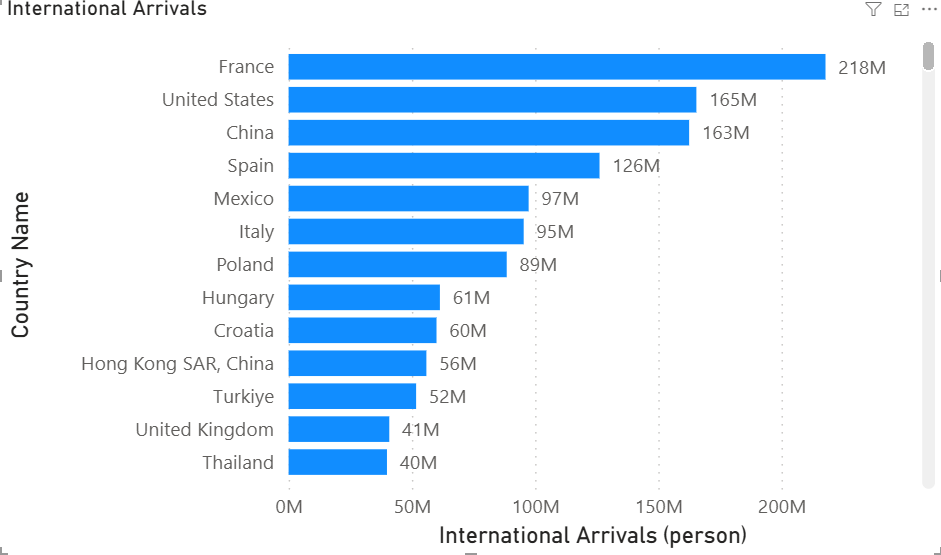
So, it could be inferred that the highest number of tourist doesn’t mean the highest number of incomes we could get from them. This shows the difference of spendings each traveller used between those in US and other countries.
Based on report as of 2023, we found that the US’s most visited city by the international travellers are NYC, Miami, and Los Angeles, respectively.
What makes the Country earn the Money from international tourists?
Well, we created the correlation coefficient heatmap to find out which has the biggest contribution to the international tourism receipts and other indicators. Then, we found the interesting correlations as follows.
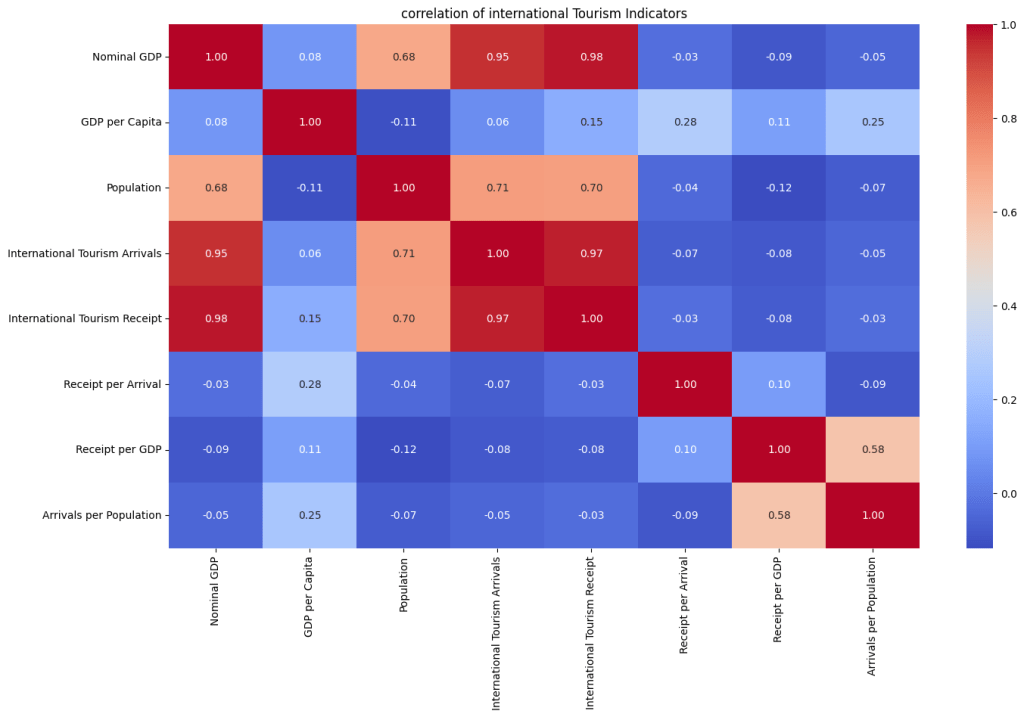
When we focused on the international tourist arrivals and international tourist receipts, we found that they also have a very strong positive correlation with each other (0.97). Then, we found that those figures have a strong positive correlation with each country’s GDP (~0.9) and population (~0.7) as well. While the number and spending have a very weak correlation to spending amount per tourist, which means we couldn’t use solely either the number of tourists or the total number of tourism receipts to determine tourists’ quality.
Conclusions
Based on the studies mentioned above, we could briefly conclude that.
- Economies of the Caribbeans (island countries in the Caribbean Sea) highly depend on international tourism. It does make sense as they have limitations to economic resources (land, capital, labour, natural resources). These are the challenges for those governments to address the risk exposure in case international tourism doesn’t work like those in COVID-19 pandemic.
- The United States gets, by far, the biggest monetary amount from international tourism, thanks to its tourists’ purchasing power compared to its competitors. NYC, Miami, and LA are still the tourists’ favourite destinations.
- The larger number of tourists doesn’t mean the better quality of tourists. This is the statements which each government could use to determine its strategy to get the market share from global international tourism.
- There might be more indicators that reasonably contribute to the number and income from international tourists, but we will leave it for further studies.


Leave a comment